-
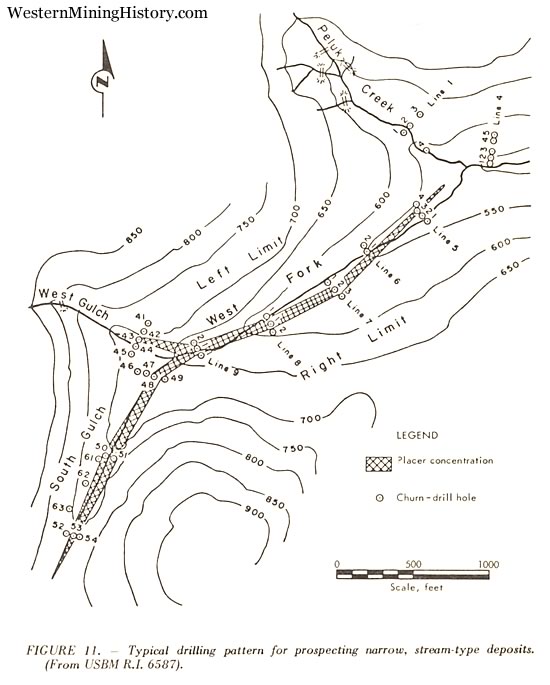
As a rule, when prospecting narrow, stream-type deposits the holes are drilled at relatively close intervals along lines laid out at right angles to the general trend of the deposit as shown in Figure 11. Hole spacing along the line is commonly 100 feet or less, while the distance between drill lines is greater, often on the order of 500 feet or more. This type of drilling pattern is designed to search out and delineate relatively narrow pay channels.
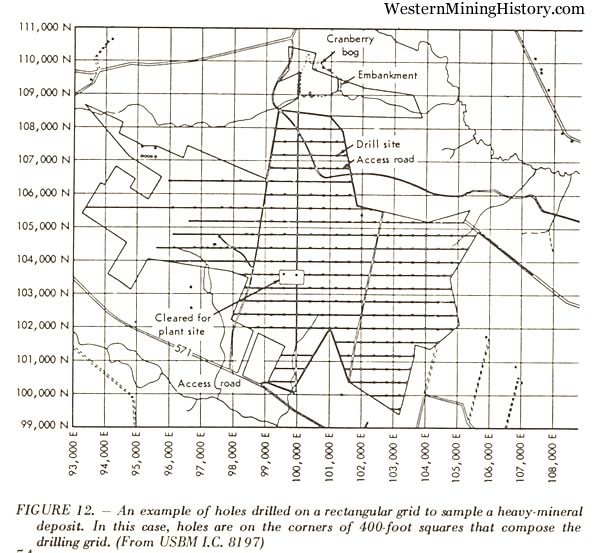
In widespread placers, particularly those having a somewhat uniform mineral distribution, holes are usually put down at the intersections of a rectangular grid pattern designed to cover the deposit as shown in Figure 12. The drilling ratio will vary from one hole for every acre to one hole for every 2, 3 or possibly 10 acres, depending on the distribution of mineral, previous experience in similar ground and other factors. In the Folsom, California dredge field the average hole density was about 1 hole for every 4 acres. On the other hand, there are placers which cannot be adequately sampled by any amount of drilling.
Although a regular drilling pattern may be preferred, there are situations in which an irregular drill pattern should be employed. In any case, it is important to avoid placing the holes in a way that would tend to exaggerate either the higher or the lower-grade areas. The selection of a drilling pattern and the initial placement of holes is normally a responsibility of the engineer in charge.
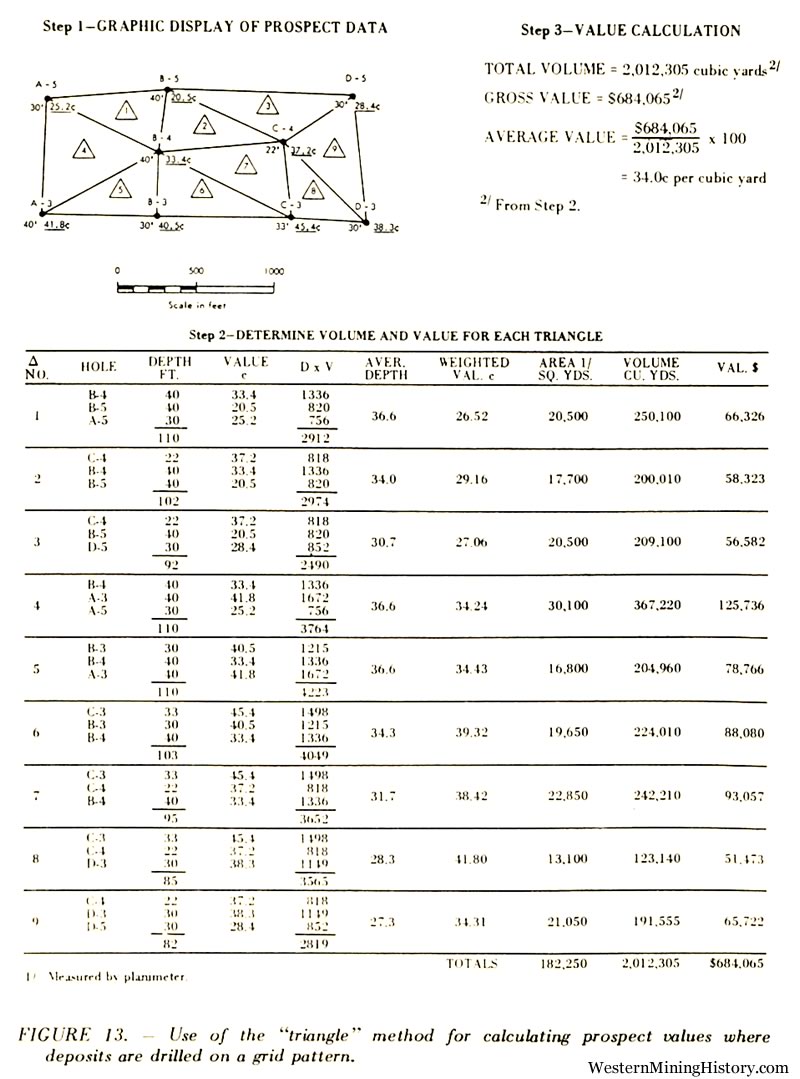
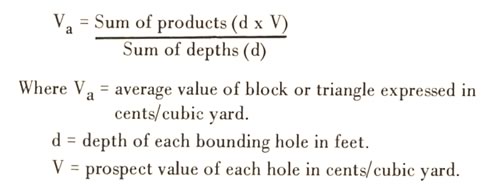
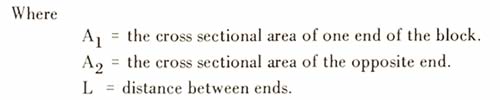
Assuming a completed drilling project with favorable results, the next step is to make an overall evaluation. To calculate the yardage and the average value of a deposit which has been drilled on a grid pattern, the drill holes are first connected by imaginary lines to divide the deposit into blocks or triangles. See Fig. 13. The volume and value of each triangle or block is then calculated using weighted drill holes values and standard ore reserve calculation procedures. The procedural details will not be set out here as they are well known to most field engineers and have been adequately covered in the technical literature. Daily (1962, pp. 86, 87) and Doheny (1942, Part II, pp. 43, 44) have described the applications to placers. In principle, the value of each block or triangle is calculated by the following formula:
A value for the deposit is subsequently arrived at by combining the individual triangles as shown in Figure 13.
For the valuation of narrow, stream-type deposits where the holes are drilled at close intervals, say 50 or 100 feet apart on relatively far-spaced drill lines, a calculation based on the mean-area formula is usually employed. This relies on a formula used for making cut and fill estimates in road work in which it is inferred that the volume of a prism having somewhat similar end sections can be expressed by the equation:
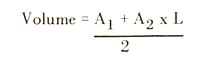
Applied to placer valuation, the average prospect value of the two end sections of a gravel block is calculated and this value applied to the block volume derived from the foregoing equation. See Fig. 14.
When computing the average prospect value of each end section it will, of course, be necessary to consider the area of influence exerted by each drill hole. At the risk of oversimplification, a commonly used procedure can be described as follows:
Consider an elongated block of gravel bounded on its two ends by drill lines containing relatively close-spaced holes. The cross-sectional area between each pair of holes is found by multiplying their average depth by the distance between them. Multiplying this area by the weighted prospect value of the two bounding holes gives an area x value figure. This procedure is repeated for each pair of holes across the line and the same is done at the opposite end of the gravel block. To find the average value of the two drill lines, divide the sum of area x value products (from both lines) by the sum of th,e individual areas. The resultant weighted prospect value for the combined ends is then applied to the entire volume between the drill lines to arrive at a dollar value for the gravel block. The procedure is illustrated by Figure 14.
When drilling a gold placer, two holes put down in close proximity will rarely check and, in fact, the divergence in value will probably be too great to be reconciled by the layman. This problem is not necessarily a reflection on the drilling itself but, instead, reflects the small sample area encompassed by a 7 1/2-inch drive shoe and the typically irregular distribution of gold in placers. Interpreting "check" holes is another of the many things in placer valuation which rely heavily on experienced-based judgement.
In a like manner shafts sunk over drill holes should be expected to show appreciable variations in value when compared with their respective drill holes. This is particularly true in loose formations or in old tailings where drilling conditions may be far from ideal. Check shafts put down over drill holes do, however, allow inspection of the gravel in place thus providing the examining engineer with a wealth of information not available from drilling alone which in turn results in a more accurate evaluation of the deposit.
The average rate and cost of the placer drilling are topics which have received little attention in the technical press, none of which is recent. This largely reflects a tendency for operating companies to keep their prospecting data confidential plus the difficulty in identifying hole-by-hole performance and cost data among general operating records.