By A. H. KOSCHMANN and M. H. BERGENDAHL - USGS 1968
Click here for the Principle Gold Producing Districts of the United States Index
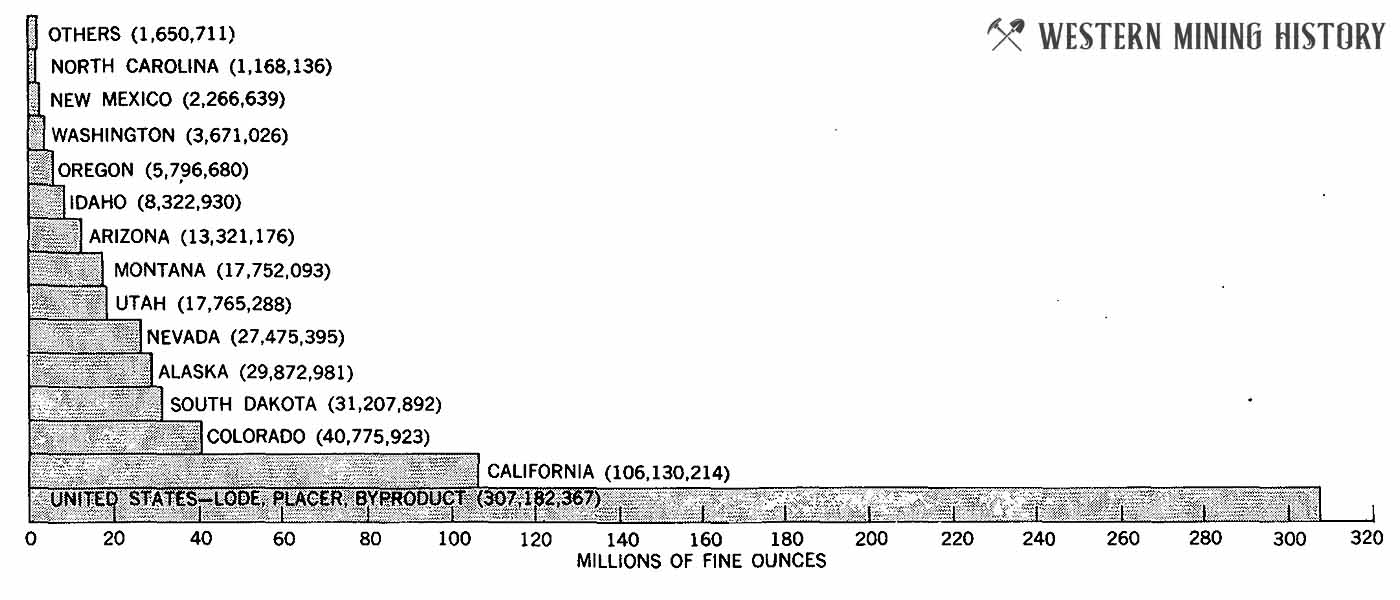
More than 75 percent of the gold mined in the United States has come from five Western States: California, Colorado, South Dakota, Alaska, and Nevada (fig. 1).

FIGURE 1. Gold production of the United States 1799 through 1965.
A total of 508 mining districts have each produced at least 10,000 ounces of gold, and many more districts have had a smaller output. Of the principal districts, 269 have produced between 10,000 and 100,000 ounces, 191 have produced between 100,000 and 1 million ounces, and 48 have produced more than 1 million ounces. Four districts, Lead, S. Dak., Cripple Creek, Colo., Grass Valley-Nevada City, Calif., and Bingham, Utah, listed according to rank, have each produced more than 10 million ounces and Lead has produced more than 20 million ounces. The 508 principal districts are distributed among the States as follows:
|
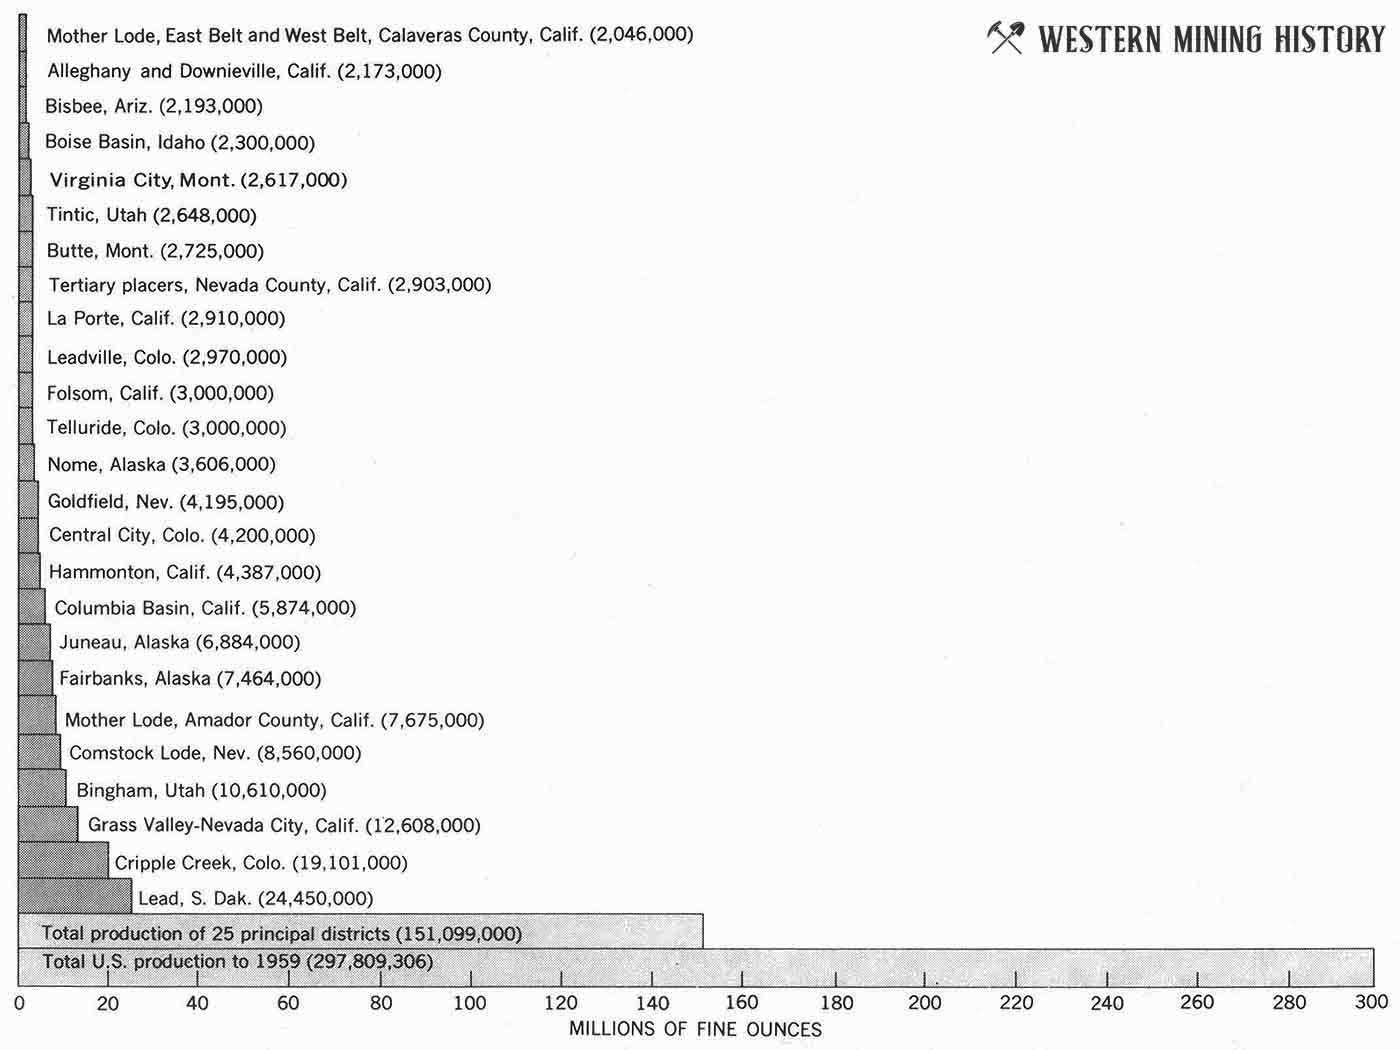
About one-half of the gold mined in the United States has come from the 25 districts listed in figure 2.

FIGURE 2. - Gold production (to nearest 1,000 ounces) of 25 principal gold-mining districts of the United States - through 1959.
GEOLOGIC RELATIONS
In general, gold is derived from three types of ore: (1) ore in which gold is the principal metal of value, (2) base-metal ore which yields gold as a byproduct, and (3) placers.
Most of the principal gold-producing districts are in the mountainous areas of the United States, where folding, faulting, and igneous intrusions have deformed the rocks. In contrast, many large base-metal deposits are found in the large relatively un-deformed areas of the Central and Eastern States, but gold is not even a byproduct of these ores. Large parts of the Western States, such as the Colorado Plateau, the Columbia Plateau, and much of Wyoming, have not been subjected to violent tectonic forces and consequently contain very few gold deposits.
The occurrence of gold is erratic and many rich ore deposits have yielded relatively little or no gold. Foremost among these are the large silver-lead deposits of Coeur d'Alene, Idaho, Aspen, Colo., and Magdalena, N. Mex.; the copper deposits of Copper Mountain (Morenci), Ray, Miami, and Superior in Arizona; and the copper deposits of Santa Rita, N. Mex., and the Keweenaw Peninsula, Mich.
Most of the gold deposits in the United States are associated with and are perhaps genetically related to small batholiths, stocks, and satellitic intrusive bodies of quartz monzonitic composition that range in age from Jurassic to Tertiary. Some deposits, such as those in the Southeastern States, may be genetically related to granitic bodies that were intruded at the close of Paleozoic time, and a few deposits, as at Jerome, Ariz., are Precambrian in age.
HISTORY OF GOLD MINING AND TRENDS IN PRODUCTION
Gold in the United States was first mined in the Southeastern States about 1799, but these deposits, though rich, were relatively small. After the discovery of placer gold in California in 1848, the Western States contributed the bulk of the domestic gold production. Placer deposits offered quick and large returns with simple equipment and thus stimulated migration to the new gold fields.
Many prospectors, trained in the California gold fields, spread to other parts of the new territories and many deposits were found in rapid succession in widely separated areas. The discovery of these rich placer deposits marked the beginning of active development and settlement of the West. Exploration and mining activity boomed; gold production reached 2 million ounces in 1850 and 3 million ounces in 1853. It then declined steadily and in 1862 again dropped below the 2-million-ounce level. Placers were the chief source of our domestic output until 1873 (Loughlin and others, 1930, fig. 3), when their output was exceeded by that of lode mines, a relation that has continued through 1965.
Placer activity remained at a relatively low ebb during the 1880's and early 1890's, but there were three periods in later years when placer production, though exceeded by lode production, formed a significant proportion of the domestic output in 1896 when large dredges were introduced in California, in 1904 when large deposits of rich gravels were discovered in Alaska, and in 1934 when the price of gold was increased to $35 an ounce.
In many districts the prospectors followed gold-bearing gravel to the source of the gold in veins, and lode mining began shortly after placer mining. It was not, however, until about the middle 1860's, when the Mother Lode and Grass Valley lodes in California and the Comstock Lode in Nevada became important producers, that lode mines became significant sources of gold.
Lode production increased rapidly after the discovery of gold in the Cripple Creek district, Colorado, in 1892. By 1898, production from this district together with the increased placer production in California and the accelerated output of the Homestake mine at Lead, S. Dak., had raised our annual gold production to more than 3 million ounces.
Production continued to rise with the discoveries of gold at Tonopah, Nev., in 1903, the placer deposits of Alaska in 1904, and gold at Goldfield, Nev., in 1905. By 1905 gold production for the first time exceeded 4 million ounces, a level maintained until 1917. Because of a shortage of manpower during World War I, production then declined rapidly, falling almost to the 2-million-ounce level by 1920, where it remained until 1934.
Many gold mines were reopened during the depression in the early 1930's. When the price of gold was raised in 1934 from $20.67 to $35 per ounce, production increased rapidly and in 1937 again passed the 4-million-ounce mark. Additional gold was obtained as a byproduct from increased output of base metals in the late 1930's, and in 1940 gold production reached an alltime high of 4,869,949 ounces.
Shortly after the United States entered World War II, the gold mines were closed, and gold production in 1944 and 1945 dropped below the 1-million-ounce mark, the lowest since 1849. Production in 1965 was 1,705,190 ounces.
From 1907 until 1943 byproduct gold, obtained from base-metal ores, formed a small, though significant, fraction of the total production of this country. Only in World War II (1943-45 inclusive), when base-metal production increased and gold mines were closed, did byproduct gold contribute more than 50 percent of our annual domestic production, and since 1951 it has steadily outranked placer production.
Most of the byproduct gold is recovered from porphyry copper ores. Large-scale copper mining at Bingham, Utah, has yielded sufficient gold to put this district in second place in annual gold production in recent years. The Lead district, South Dakota, has had the greatest total gold production and was also the largest producer in the United States each year from 1946 through 1965
In an analysis of gold-production trends, the period 1932-59 is particularly informative because it reflects the most flourishing and the most adverse periods of gold mining in the United States. A long period of desultory activity ended in 1934 when the price of gold was increased from $20.67 to $35 per ounce. Mines were opened that had been closed for decades, and the gold-mining industry experienced an unprecedented interval of prosperity. This was ended in 1942 by the imposition of War Production Board Order L-208 (U.S. Bureau of Mines, 1943, p. 80-84), which resulted in most of the gold mines closing for the duration of World War II.
After World War II, the gold-mining industry, plagued by constantly rising costs under a fixed selling price, failed to experience the growth and robust activity enjoyed by most industries. Thus, gold mining has been somewhat paradoxical it reached its zenith in an economic climate unfavorable to most other industries, and it declined sharply when industrial growth was accelerating.
Of the 508 principal districts, in 1959 about 400 were either dormant or had an annual production of less than 100 ounces. Of the 25 leading districts (listed in fig. 2), 8 are dormant, 5 produce less than 100 ounces annually or have sporadic production, and only 12 of them maintain activity comparable to that of the prewar period.