WMH Gold Maps is available in two versions: Standard and Enhanced.
Gold Maps Standard
WMH Gold Maps Standard are comprehensive mapping tools for exploring the gold regions of the Western United States. The packages can be used with Google Earth or GIS applications. The following files are included in each state-based package:
- Locations of all mines, deposits, and occurrences in the USGS MRDS database that have gold as a primary commodity
- Locations of all mines, deposits, and occurrences in the USGS MRDS database that have gold as a secondary or tertiary commodity
- Gold district locations
Gold Maps Standard packages are available for Colorado, Nevada, New Mexico, South Dakota, and Utah. Gold Maps Enhanced packages are available for additional states; see below for more information.
Gold Mine Data
Gold mine data comes in two file formats: CSV and KMZ. The records separated into groups of mines, deposits, and occurrences where gold is the primary commodity, and where gold is either a secondary or tertiary commodity (secondary and tertiary data is combined in the “secondary” layer). The groups are further organized into counties.
The KMZ files are ready to use in Google Earth or other applications designed to display KML data. Note that KMZ is just a compressed KML file. They are effectively the same thing when discussing their use.
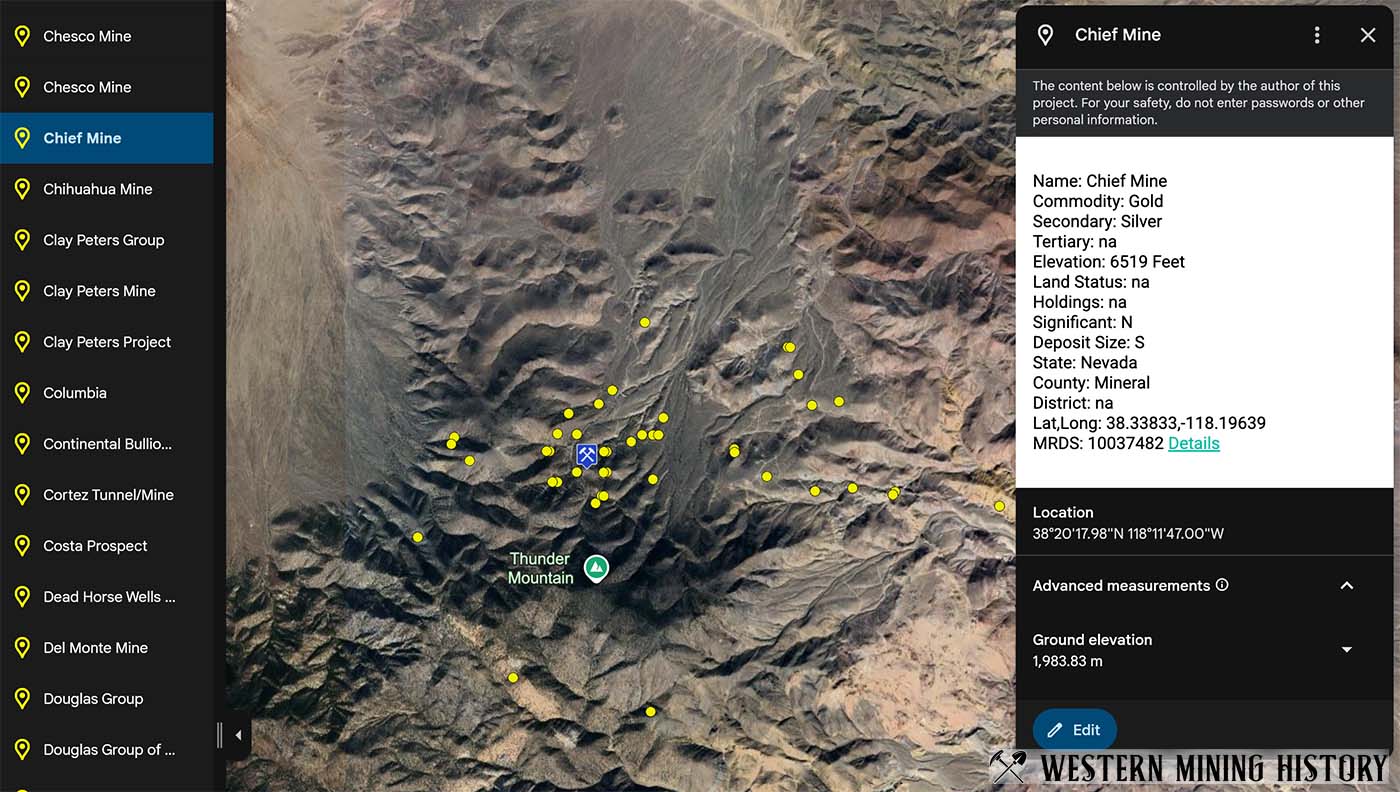
The CSV files can be used in GIS, database, or spreadsheet applications.
Important note on mine data: Although the USGS MRDS database contains a lot of valuable information, it is far from perfect. There are numerous duplicate records and records with bad coordinates. You can expect to see mines that are clearly in the wrong county or even sometimes the wrong state.
Despite these issues, the majority of the mine records are either precisely located, or at least located in close vicinity to the mine. Additional research using topo maps, USGS publications, or satellite imagery may be needed to find the mine features you are interested in.
Gold District Locations
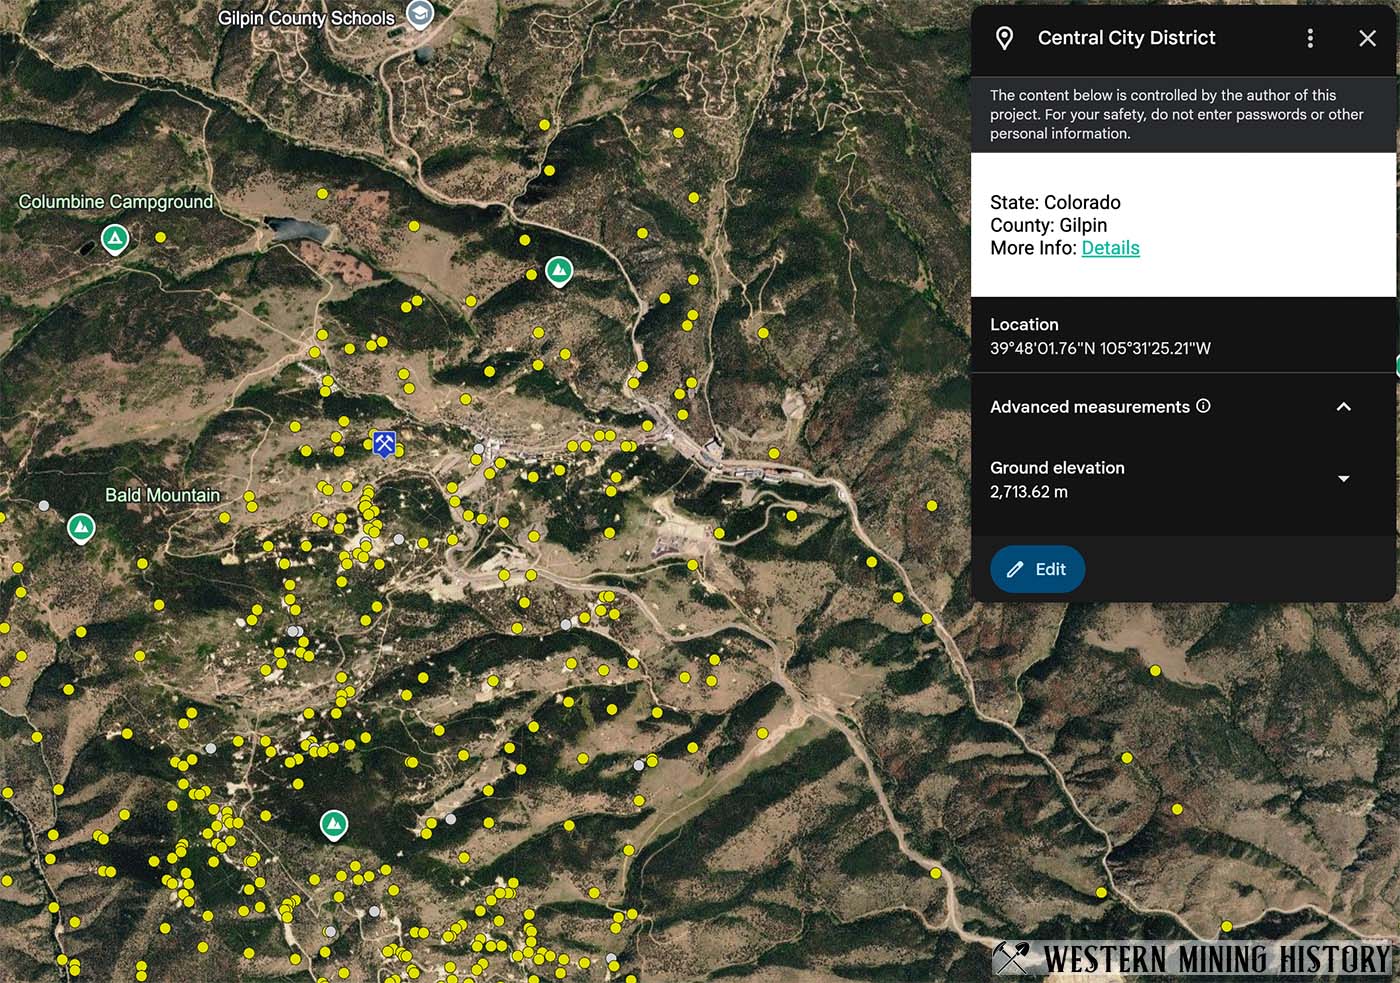
The locations of historical gold mining districts are included. Because gold districts rarely have precisely defined boundaries, the markers are placed near the approximate center of each district.
Gold Maps Enhanced
In addition to the standard map data detailed above, Gold Map Enhanced packages include analysis that identifies areas with high potential for finding placer gold. Gold Map Enhanced is available for Arizona, California, Idaho, Montana, Oregon, and Washington. The following files are included:
- Locations of all PLSS sections that contain active placer mining claims
- Analysis layer that summarizes data for mines and claims by township
- Ranking layer that identifies the top townships by density of placer claims and gold mines
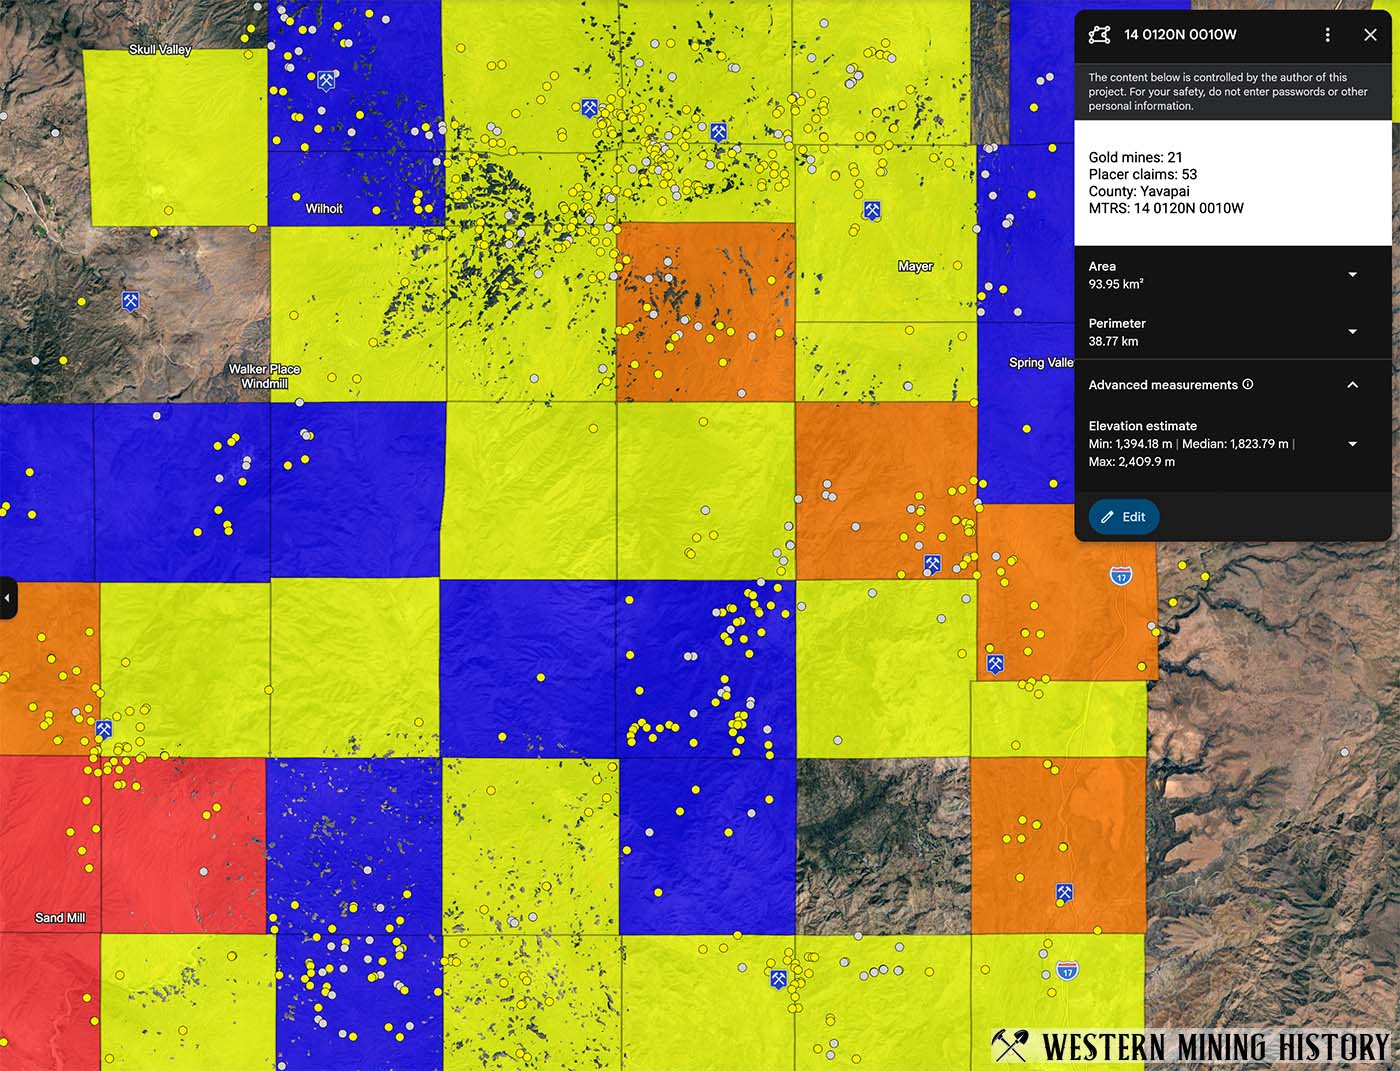
WMH Gold Maps Enhanced can be used in Google Earth or GIS applications to research areas with gold discovery potential. These mapping tools visualize related data sets that together identify areas of high gold potential by looking at where historical gold mines are located, and where placer mining is still occurring today.
Placer Claim Data
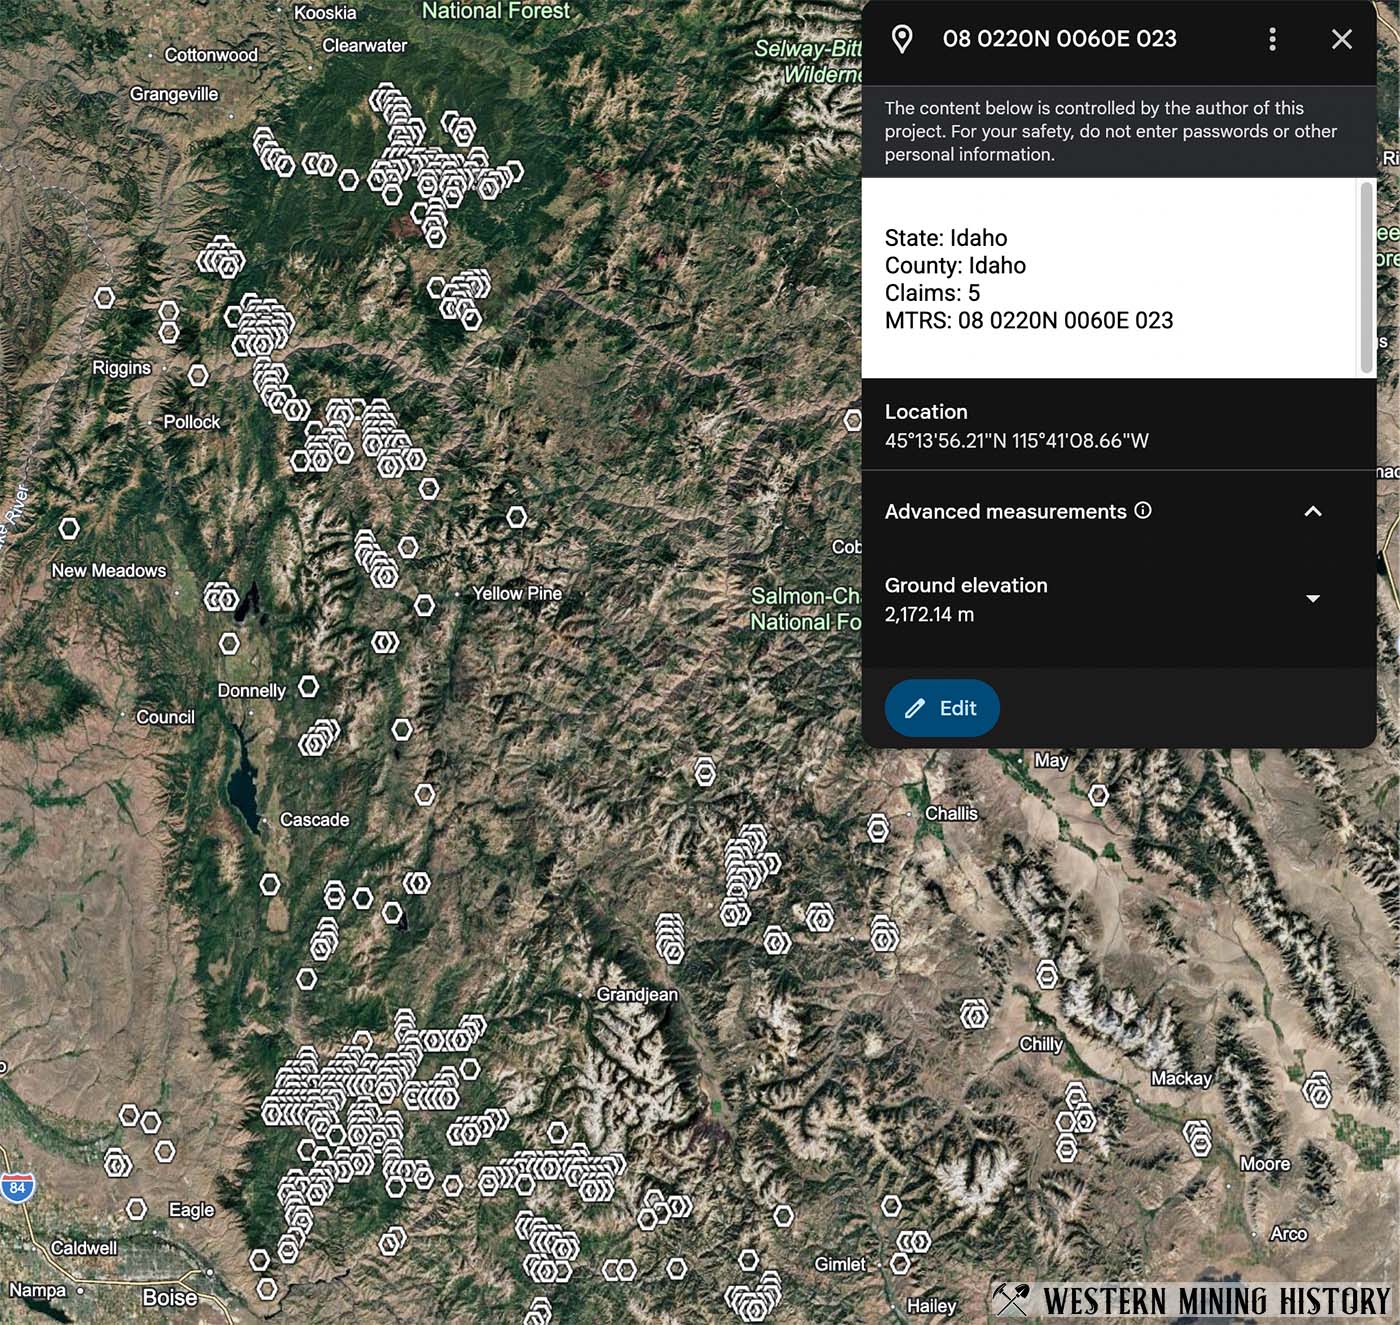
The CSV file contains all PLSS sections that contain placer claims in the state and can be used in GIS, database, or spreadsheet applications. This data can also be imported into Google Earth to create your own custom views.
The info windows display the number of claims and the MTRS value of the PLSS section that the claims are located in. MTRS is the acronym for Meridian, Township, Range, Section, and represents the grid system used to survey public lands. The MTRS value for each claim marker can be used to shortcut the BLM MTRS claims index search form, saving a lot of time in what is generally a very slow and cumbersome system to use.
Note that the placer claim data is meant to be a guide as to where modern claims are located. It is not an up to date source of claim data, claim research should always be finalized with the BLM MTRS application. For more information view the following article: Researching Mining Claims with the BLM MTRS.
Gold Maps include mining claim data obtained from the BLM in August 2020.
Gold Region Analysis by Township
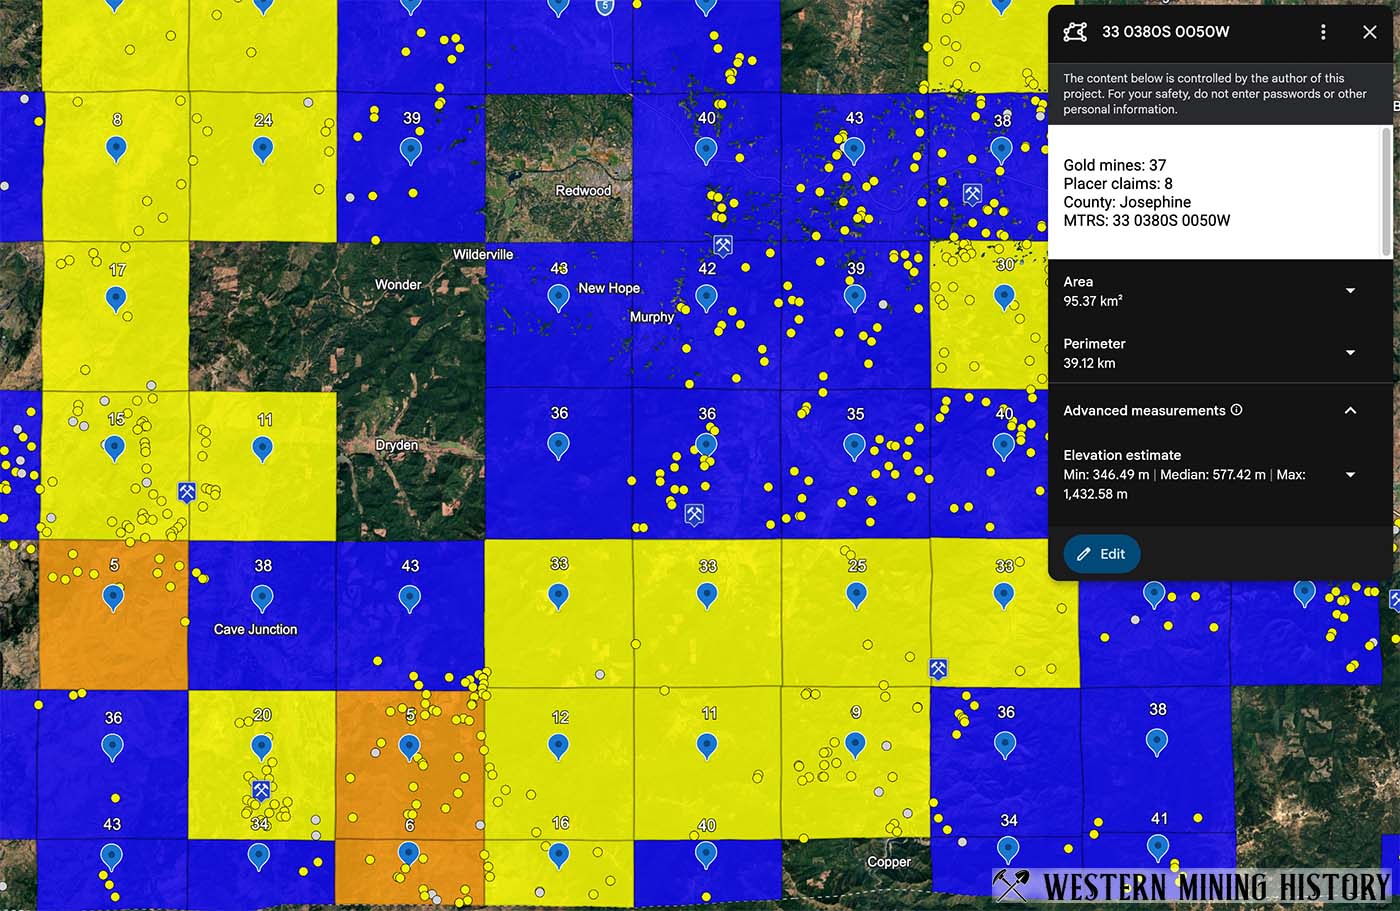
This layer identifies PLSS townships that contain both active placer claims and historical gold mines. This correlation is valuable for two reasons. First, it helps identify areas where placer claims are likely maintained for gold mining rather than for other surface commodities, such as gypsum or potash. Second, it provides a quick visual overview of the density and distribution of gold mining areas across a state.
Townships containing both active placer claims and historical gold mine records are shaded according to the number of active placer claims within the township:
1–10 claims: blue
11–50 claims: yellow
51–100 claims: orange
More than 100 claims: red
Also included is a layer that ranks the top 50 gold-bearing township by the total number of claims in them.
Purchase Gold Maps
There are no refunds on digital products. Please take some time to understand what you are buying. These packages are intended for use in Google Earth or GIS applications, they are not mobile apps. Please contact us before purchasing if you have questions.
Click on any of the links below to visit the page for that product.
Gold Maps Standard $20
Gold Maps Enhanced $30