This page contains instructions for the use of WMH Mine Discovery Tools for Google Earth Pro.
Quick Start Guide
1. Once you have downloaded the WMH Mine Discovery Tools package, unzip the file archive.
2. Using Google Earth Pro, open the file County-State-Mine-Discovery-Tools.kmz from the Mine Discovery Tools package where “State” and “County” match the package you purchased, ie Sierra-CA-Mine-Discovery-Tools.kmz (not all features of the Mine Discovery Tools will work in the Chrome version of Google Earth).
3. The Mines Discovery Tools files will now be in the “Temporary Places” section in the left panel of Google Earth Pro. Either right click on the top level directory “Mine Discovery Tools”, and choose “Save to My Places”, or simply drag the folder up to the “My Places” section. You may need to click the arrows next to the folders to expand them again.
Now each time you open Google Earth Pro, the files will already be loaded and ready to go. This is how your “My Places” panel should now look (note that not every package contains gold district data):
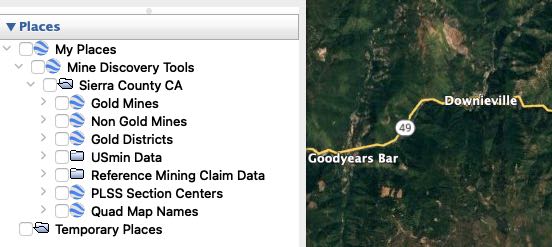
4. Click the checkbox for the data layer you would like to view: Gold Mines, Non-Gold Mines, Gold Districts (if available), USmin Data, Reference Mining Claim Data, PLSS Section Centers. Or Quad Map Names. To automatically zoom into the area where the data is displayed, double click on the place name in the “My Places” panel. The number of layers, and the amount of data that you will be able to display at once, is determined by the processing power of the computer you are using.
Note: As of version 3.1, the USmin Data and the PLSS Section Centers are in separate files located in the “Extras” folder and need to be opened separately. These files contain a lot of data and removing them from the main file will improve performance when they are not needed.
Tips and Settings
There are a few settings you will probably want to change in Google Earth Pro to optimize the display of the data in the Mine Discovery Tools.
Tilt View
The first and most important setting you will want to change is to turn off “tilt view”.
On a PC, In the “Tools” menu, select “Options”, then in the navigation tab, navigation panel, select the “Do not automatically tilt while zooming” radio button. Click the “Apply” button, then “OK”.
On a Mac, in the “Google Earth Pro” menu, choose “Preferences”, then in the “navigation” panel choose the “Do not automatically tilt while zooming” radio button. Click “OK”.
If after turning off tilt view, you still have some tilt in your view, hit the “U” key on your keyboard and your view will return to vertical.
Terrain
In the Google Earth Pro left menu, in the “Layers” panel, you may want to uncheck “Terrain”. In some cases the data layers are easier to interpret with this off, but this is personal preference.
Marker Styles
Mine markers have the labels disabled to decrease clutter and improve map performance in Google Earth Pro. If you want to enable labels, change the label or icon size and color, you can do so in the edit folder window.
Right click on the folder you want to edit like “Gold Mines” and choose “Get Info” from the menu and then the “style, color” tab (if prompted, choose the “share style” option).
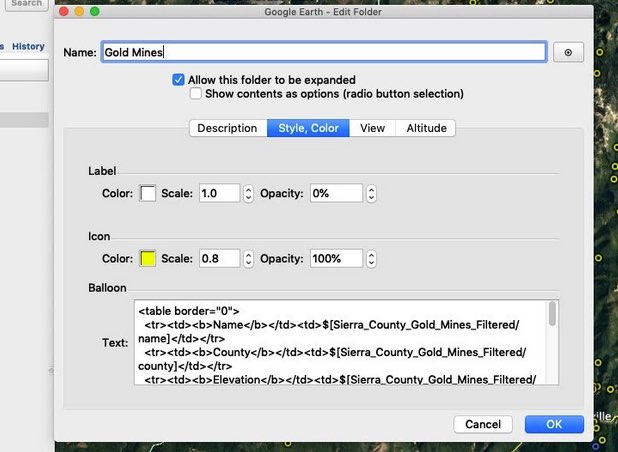
To enable labels, change the opacity setting to “100%”. Changing the color or scale values of the icon will change how the icons appear on the map.
If you want to save the settings you have changed, right click the folder in the left panel and select “Save Place As…” and save a new KMZ file
Fonts
You may find that the default fonts that are used in mine and claim names are too large for your liking, especially in map images you save for the purpose of printing. The fonts can be changed by adjusting the “Choose 3D Font” setting.
On a PC, In the “Tools” menu, select “Options”, then in the “3D View” tab click the “Choose 3D Font” button in the Fonts panel. The default font size is 16, you may want to try 14 or 12, and change the font type if you desire. Click “Apply” then “OK”.
On a Mac, in the “Google Earth Pro” menu, choose “Preferences”, then in the “3D View” tab click the “Choose 3D Font” button in the Fonts panel. The default font size is 16, you may want to try 14 or 12, and change the font type if you desire. Click “Apply” then “OK”.
You will need to restart Google Earth Pro to see font changes.
Mine Data
The mine data included in the Mine Discovery Tools is sourced from the USGS MRDS database.
Important Information on MRDS Data
Although the USGS MRDS database contains a lot of valuable information, it is far from perfect. There are numerous duplicate mine records and records with bad coordinates. You can expect to see mines that are clearly in the wrong county or even sometimes the wrong state. It appears that mines that had no coordinate data were simply assigned the center point coordinates for the county they reside in, resulting in a dense group of mines in the middle of the county that are clearly mislocated.
Despite these issues, the majority of the mine records are either precisely located, or at least located in close vicinity to the mine. Additional research using topo maps, USGS publications, or satellite imagery may be needed to find the mine features you are interested in.
It should be assumed that all mines are on private property unless research proves otherwise.
Files and Data
The mines have been divided into two files – one for mines that have gold listed as a primary commodity, and a second file for mines that do not have gold listed as a primary commodity. The mine files in the 3.x version and above use data from the WMH expanded mine data index, which has more information in each info window.
Note: mines in the non-gold category may still have gold listed as a secondary commodity, so additional research may be needed on particular mines if minor gold producers are of interest.
In some packages, mine data from previous versions is included in the “Extras” folder which have been manually edited to remove the many duplicate mine records that make mapping MRDS data problematic (the sales pages detail whether a package comes with filtered MRDS data). Mines with obviously bad coordinates have also been removed. These edited files used data from the standard mine data index, and have less information in each info window.
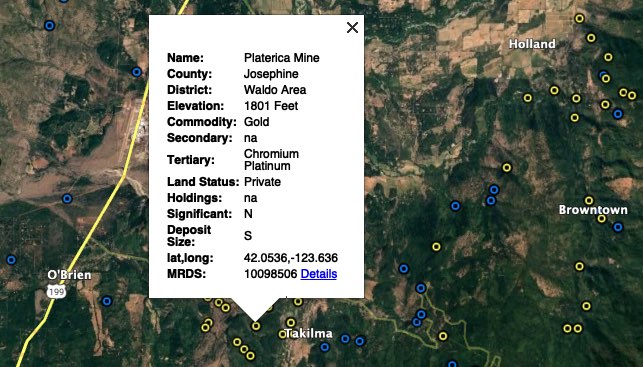
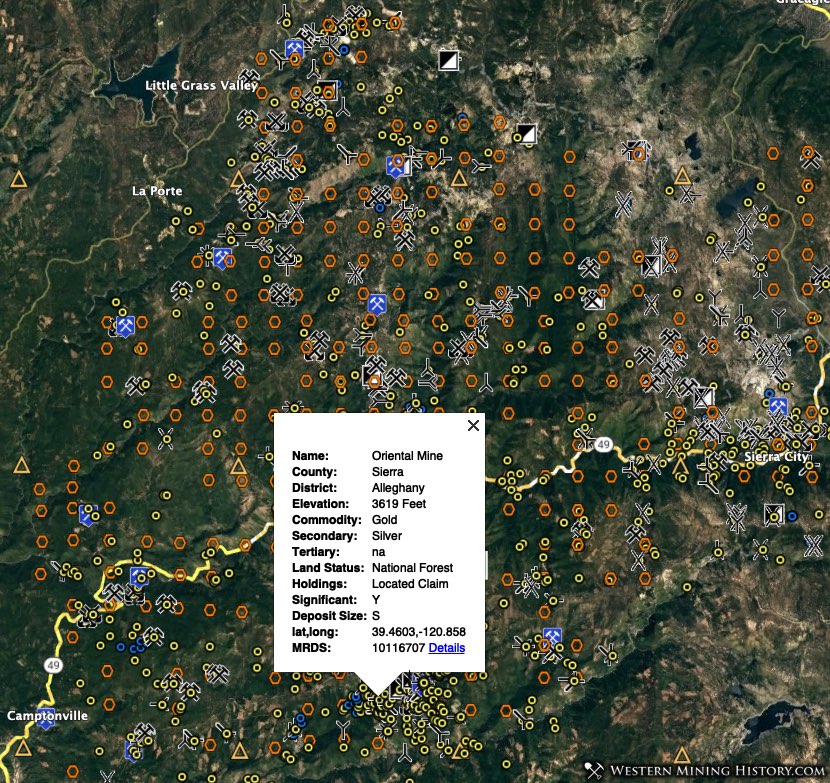
Viewing Mine Details
Each mine info window contains the MRDS value for that mine. Clicking the detail link will open the mine detail page at Western Mining History.
USmin Data
The mine symbol data from the USGS USmin Mineral Deposit Database is included for each county.
The USGS describes the data as “symbols indicating mining-related features digitized from historical USGS topographic maps in the western part of the conterminous US. Includes prospect pits, mine shafts and adits, quarries, open-pit mines, tailings piles and ponds, gravel and borrow pits, and other features.”
The USmin data distributed with WMH Mine Discovery Tools is in the form of unedited kml files distributed by the USGS.
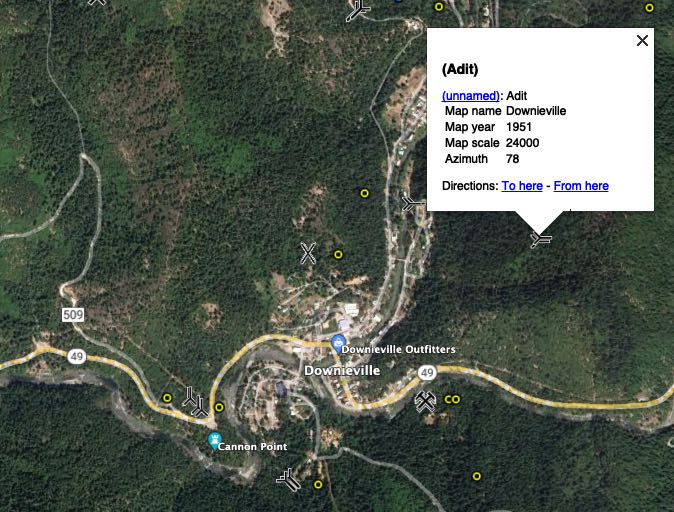
The USmin data inexplicably contains a lot of duplicate records, nonetheless it helps understand the surface features related to historical mines. Adit markers indicate the direction that the adit enters the ground.
One problem with MRDS mine records is that they are defined as a single point when most mines have more than one surface feature and may cover a significant area. USmin data, in conjunction with MRDS data helps obtain a better understanding of the nature and extent of surface features related to mines.
The USmin data layer loads map icons from a USGS server, so you must be connected to the internet and the USGS MRData servers must be online for this feature to work.
Important Note: Google Earth sometimes adds “Directions: To here – From here” to some of the data. Do not use this feature to navigate as it’s likely going to get you lost. Be sure you have the proper knowledge and equipment to safely navigate back country roads.
Claim Data
The reference claims data included in this package are custom indexes created from MLRS (formerly LR200) data distributed by the BLM. The claims data has been merged with coordinate data for PLSS section center points so that claim locations can be displayed by location in Google Earth Pro or GIS applications.
Reference claim data was created in November 2020, and is designed to provide a snapshot in time as to where claims were located at the time the data was retrieved, and where they are likely located now. However, since new claims can be filed and active claims can expire at any time, it is essential that the BLM MTRS is always referenced when doing claims research.
It doesn’t matter if the third party reference data, from WMH or another source, is one month old or a year old, you still have to verify it with the MLRS.
More information: Researching Mining Claims with the BLM MLRS
Claim Markers
The claim marker names are in the following format:
L2 – a section has 2 lode claims
P11 – a section has 11 placer claims
L2-P11 – a section has both 2 lode and 11 placer claims
Claim numbers with an asterisk next to them indicate that the section is irregular or unsurveyed. Examples are L2* or L6-P3*.
WMH has manually located most of the irregular sections that had active claims in them in 2020, and while they are usually as accurate as the standard sections, extra care should be done in doing claim research in these areas.
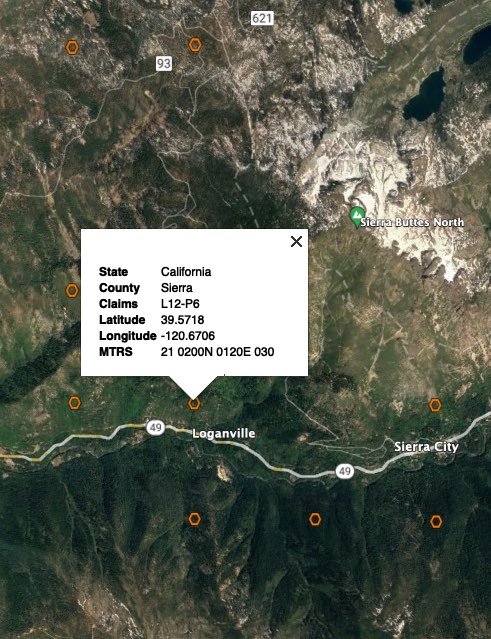
When a marker is clicked on an info window opens that includes the latitude and longitude of the PLSS section center point. This is not a coordinate that specifically identifies a claim location. Claims can be located to the nearest quarter section by looking up the claim details in the BLM’s LR2000 application, but the only way to get exact claim boundaries is to go to the county recorder’s office.
The info window also shows the MTRS value of the PLSS section that the claims are located in. MTRS is the acronym for Meridian, Township, Range, Section, and represents the grid system used to survey public lands. The MTRS value for each claim marker can be used to shortcut LR2000 claim index search form, saving a lot of time in what is generally a very slow and cumbersome system to use.
PLSS Section Centers
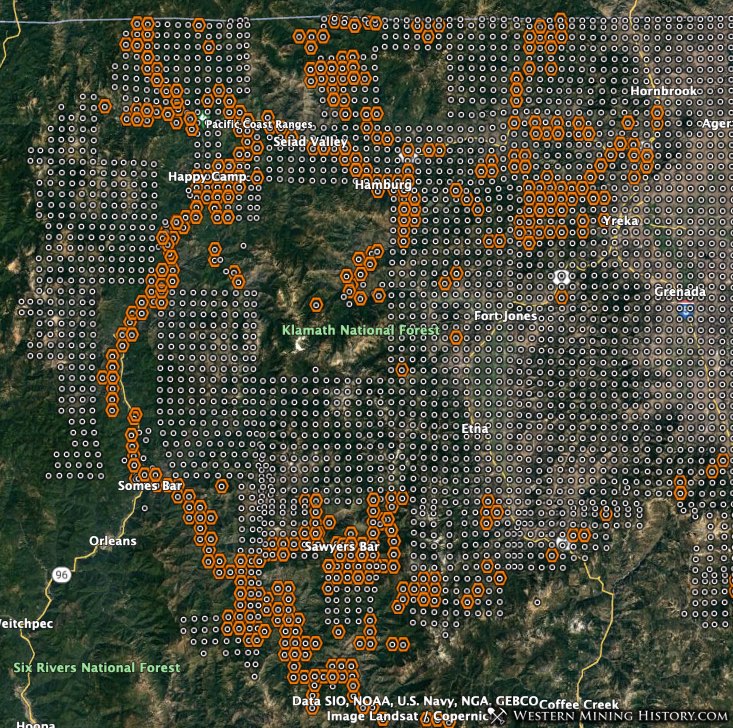
The “PLSS Section Centers” layer contains the center points for all surveyed PLSS sections. These files differ from the claims reference files described above in that they contain all surveyed PLSS sections, while the claim research tools only contain sections that had active placer claims at the time the data was obtained from the BLM.
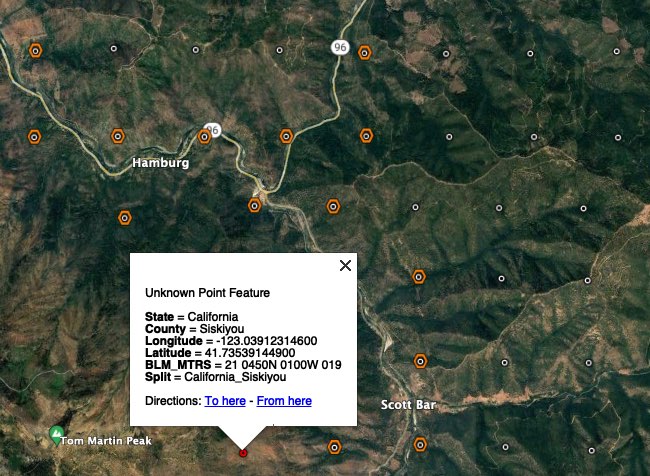
The “BLM_MTRS” field in the info window for each PLSS section center is in the same format used by the BLM MLRS application. Using these values, you can quickly search each section for active or closed mining claims.
Only the BLM_MTRS field is of interest here, the other fields in the info window can be ignored.
Topo Maps
USGS and Forest Service quad maps can be downloaded and opened in Google Earth to provide more detail in the area you are researching.
There a few reasons you might want to choose one or the other (USGS or Forest Service) maps:
1. The USGS and Forest Service maps vary in the details they contain. Each map could have unique information that will be useful for mine and claim research.
2. The USGS and Forest Service maps are distributed in different formats and resolutions.
- The USGS maps are distributed as image maps displayed with KMZ files. This has the advantage of the maps being ready to use immediately in Google Earth Pro. A disadvantage is that the map images use a lot of memory, and only a limited number of them can be open at one time before Google Earth Pro begins to perform poorly.
- The Forest Service maps are distributed as high-resolution TIFF images that need to be converted into super overlays before they can be used. While this takes time to set up at first, the result is extremely detailed maps that perform very well in Google Earth Pro. With super overlays, you will likely be able to have all the maps for an entire county open while doing mine and claim research.
3. USGS maps cover most land areas while Forest Service maps only cover public land areas administered by the Forest Service.
Quad Map Names
The “Quad Map Names” layer contains the map name for each quadrangle that corresponds to a USGS or Forest Service Map. These names will help you quickly locate and download the maps you are interested in.
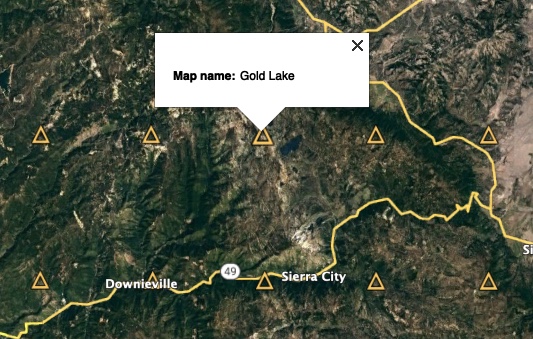
You may find it useful to turn on the labels for these markers if you would like to see all the names at once. See the Tips and Settings section above for information on how to set label opacity.
The direct URLs to the USGS and Forest Service map download pages will not be included here as they tend to change over time.
For USGS maps, search the internet for “USGS Topoview”. Once you have accessed the USGS Topoview map viewer, choose “map name” as the search type and use the name you are interested in from the Quad Map Names data layer. You will be presented with several formats to download the map in, choose the KMZ file.
Note: the USGS Topoview application distributes multiple historical maps for each quad in addition to the latest version. The search form has a date filter, adjust that to just return maps from recent years (for example 2016-2021) to more quickly identify the map you are interested in.
Note: The GeoTiff version of the files from the USGS will work if you just want to use one at a time in Google Earth (see creating super overlays below), however they are not suitable for making seamless viewing of multiple adjacent maps like the Forest Service maps. You can experiment here and see what works best for you.
For Forest Service maps, search for “forest service topo maps” and access the FSTopo map download page. The search field in this utility will allow you to search by map name.
The appropriate Forest Service maps download page can be difficult to find, this page is currently the best one to use:
https://experience.arcgis.com/experience/9ab8d03e2bec4d7fbfc27ba836e70aed/page/FSTopo
Forest Service Topo Map Super Overlays
The Forest Service topo maps are high-resolution georeferenced TIFF images. They are much larger than the USGS files so when you open them Google Earth Pro is going to prompt you to select an option that will allow them to be displayed correctly. When you get this prompt choose “Create Super Overlay…”.
Now that you have created a Forest Service super overlay map, you have a couple of options. One option is to simply open the file, or few files, that you are interested in viewing. A second option is to set up all your Forest Service super overlays now so that you have a topo map layer that can be turned on and off whenever you need it.
Since super overlays perform well in Google Earth Pro, you will be able to turn on and view the entire set of them at once (depending on the speed of your computer). These are the steps to take to create and save a full collection of Forest Service topo maps.
1. Open each Forest Service topo map and create a super overlay for each as described above. There are many FS topo maps so this will take some time, but hang in there the result will be worth it.
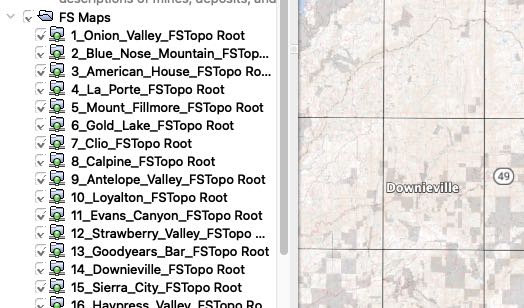
2. Most likely the maps will be placed in the “Temporary Places” part of the left panel. Once all of them have been created, add a directory in your Google Earth Pro places panel (example “FS Maps”), then select and drag the maps into the “FS Maps” directory. The image below illustrates what your super overlay maps might look like in Google Earth Pro, but you can name them whatever you want.
3. Once all the maps are in the “FS Maps” directory, right click on that directory and choose “Save Place As….”. Save the resulting KMZ file. Now when you want to open all the maps for the county, all you have to do is open this file.
Note: in theory, once you drag the maps to “FS Maps” to the “My Places” section, it should save automatically. However, this is a notoriously problematic feature of Google Earth Pro, and folders that contain a lot of data often do not save correctly. Creating your own saved file as in step 3 above is important to retain your work and to avoid the need to reopen every map individually.
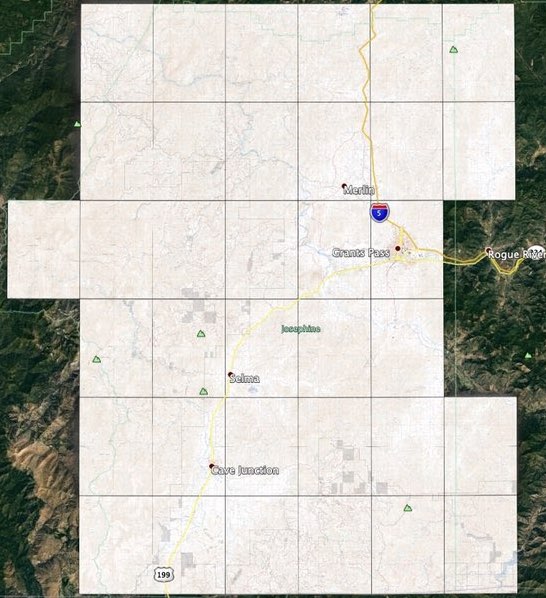
This is what full Forest Service topo map coverage of a county looks like with super overlay maps:
Exporting Map Images
A useful feature of Google Earth Pro is the ability to save high-resolution images of the maps or data you are viewing. These images can be referenced later or printed to take in the field.
The top of the Google Earth Pro interface has a row of buttons for actions that can be performed in the viewing window. Second from the right is the “Save Image” button. When clicked, a sub menu opens below the button that gives you options for the image you would like to save:
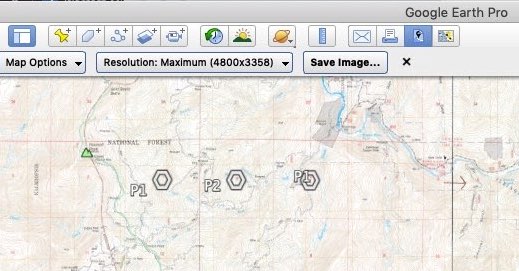
When you first use this feature the map will display a title box and legend at the top of the map. Either adjust the text in these boxes to match your desired values, or click the “Map Options” button and turn these features off.
Select the desired resolution you would like to save the image at. Note that if you choose higher resolution images, the resulting map image is going to be much larger than what you are currently viewing. High resolution images allow you to save large areas of the map that will be visible in the resulting saved image, even when you are not zoomed in to a detailed area in Google Earth Pro.
To test this, zoom out so that a large area of the map is visible, but most of the individual features are too small to read. Select the highest resolution and save the image (this will take several minutes). Open the saved image in an image viewer or browser and you will see that you have a very large map full of useful detail.
You will probably find that the fonts on your high resolution images are too large, so this is an instance where you may want to change the font size, or turn off data layers that are not needed and are obscuring features on the map. See the “Tips and Settings” section in this document for info on how to change marker fonts.
This will take some trial and error, but once you have figured out exactly how you want your saved images to be formatted, you will be able to create any custom topo map you would like.
Measuring Distances
In the tools menu at the top of Google Earth Pro, there is an icon for “Add Path”:

To find the distance between a mine and another landmark like a town or a highway, click the “Add Path” button and carefully trace the route you are interested in measuring.
When the new path dialog box opens, go to the “measurements” panel and the length of your path will be revealed.
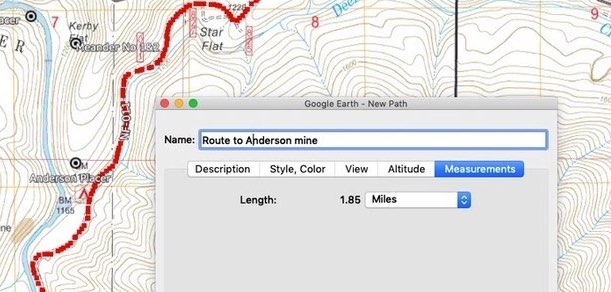
Once you have the path you want, you can save it in Google Earth Pro and open it at any time.